


The Zweig Breadth Thrust is best known for its bullish reversal signals, which capture a material increase in upside participation. There is, however, more to the indicator because traders can also use the “setup” period to identify oversold conditions. This report will explain the original Zweig Breadth Thrust and show how these signals work.
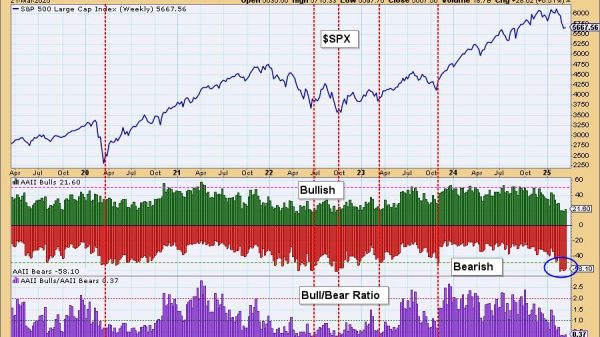
Note that our breadth models turned bearish in mid March and the major index ETFs triggered long-term downtrend signals. I am now watching for something that would prove this stance otherwise, such as a Zweig Breadth Thrust. A set up is in the making using S&P 500 data, but this has yet to translate into a signal. We will follow this setup closely in the coming days. Click here for a trial and full access to our reports and videos.
A Sharp Increase in Advancing Stocks
The Zweig Breadth Thrust (ZBT) indicator uses NYSE advance-decline data to identify major shifts in the percentage of advancing stocks (breadth). The first step is to calculate the percentage of advancing stocks (advances divided by advances plus declines). Second, apply a 10-day EMA. Thus, the indicator is the 10-day EMA of Advances/(Advances + Declines). This formula comes from Greg Morris’ book, the Encyclopedia of Breadth Indicators.
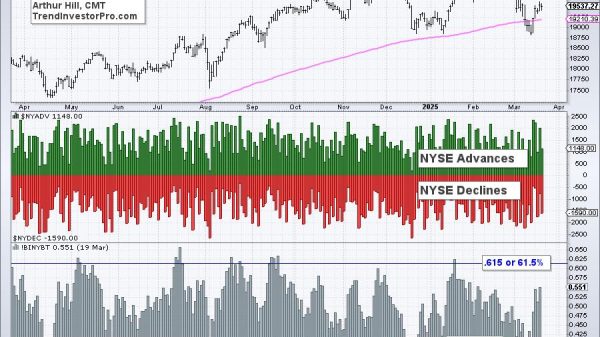
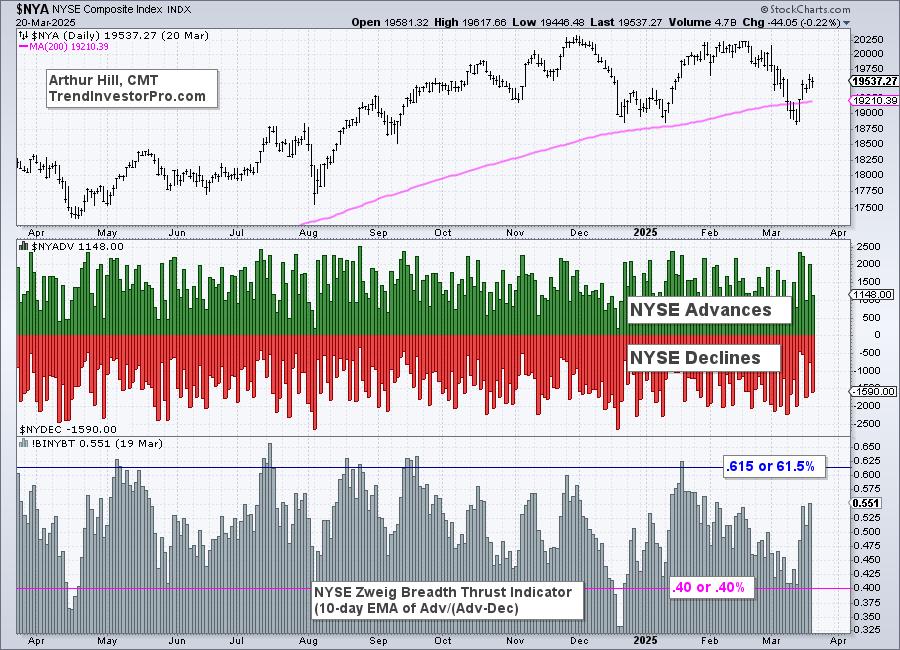
A value of .40 means the 10-day EMA is just 40%, which shows an extremely low percentage of advancing stocks. A value of .615 means the 10-day EMA is 61.5%, which shows an exceptionally large percentage of advancing stocks. For reference, the chart below shows NYSE Advances and Declines in the middle window and the ZBT indicator in the lower window.
From Setup to Signal
The Zweig Breadth Thrust triggers when the indicator moves from an extremely low level to an exceptionally high level in a short period. Such moves show a major turnaround in participation (advancing stocks). A setup occurs when the indicator dips below .40 (40%), and the Zweig Breadth Thrust signals when the indicator surges above .615 (61.5%) within 10 days.
The chart above shows the ZBT indicator (!BINYBT) in the top window, the digital signal in the middle window (!BINYBTD) and the NY Composite in the lower window. The blue shadings show the indicator surging from below .40 to above .615 within a 10 day window (April and November 2023). The pink shadings show two signals that missed the 10 day cutoff.
This indicator can also identify short-term oversold conditions with a move below .40 (40%). The gray vertical lines show four instances when this indicator became oversold (March, August, September and October 2023, April and December 2024). Short-term oversold conditions reflect an extreme pullback that can lead to a bounce.
Solid Rationale, but Something Missing
There is a solid rationale behind the Zweig Breadth Thrust, but something is missing. Those “somethings” are Nasdaq stocks. I suspect Zweig used NYSE breadth because he developed it when the big board (NYSE) dominated trading (80s). The Nasdaq is now a major exchange so a modern breadth indicator should include Nasdaq stocks. I would suggest using S&P 500 or S&P 1500 stocks. Nasdaq stocks account for around 30% of the S&P 500, which is the most important benchmark and where institutions are active. Nasdaq stocks account for around 33% of the S&P 1500, a broad index that covers large-caps, mid-caps and small-caps.
The NYSE ZBT Indicator did not move below .40 in mid March, but versions using the S&P 1500 and S&P 1500 did on March 13th. This means two things. First, the S&P 500 and S&P 1500 became oversold and ripe for a bounce. Second, a possible Zweig Breadth Thrust is setting up with March 27th as the cut off date.
The full version of this report is reversed for subscribers. We show how to set up the ZBT indicator using S&P 500 and S&P 1500 breadth, review past signals and analyze the current situation. This report includes custom SharpCharts with links and a video for deeper understanding. Click here to subscribe and gain immediate access.
///////////////////////////////////////////