


Friday’s overheated inflation data appears to have initiated a new downward leg for the major equity averages. This could mean a confirmed bear flag pattern for the S&P 500, and potentially much further lows before this corrective period is complete.
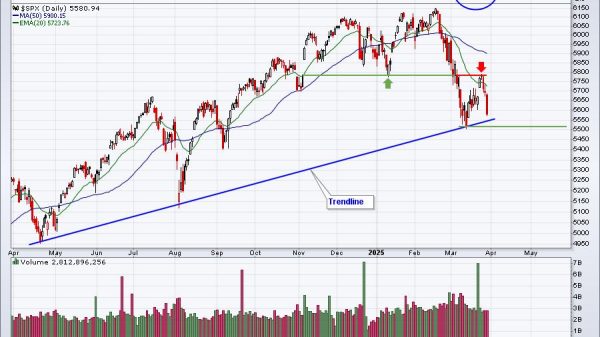
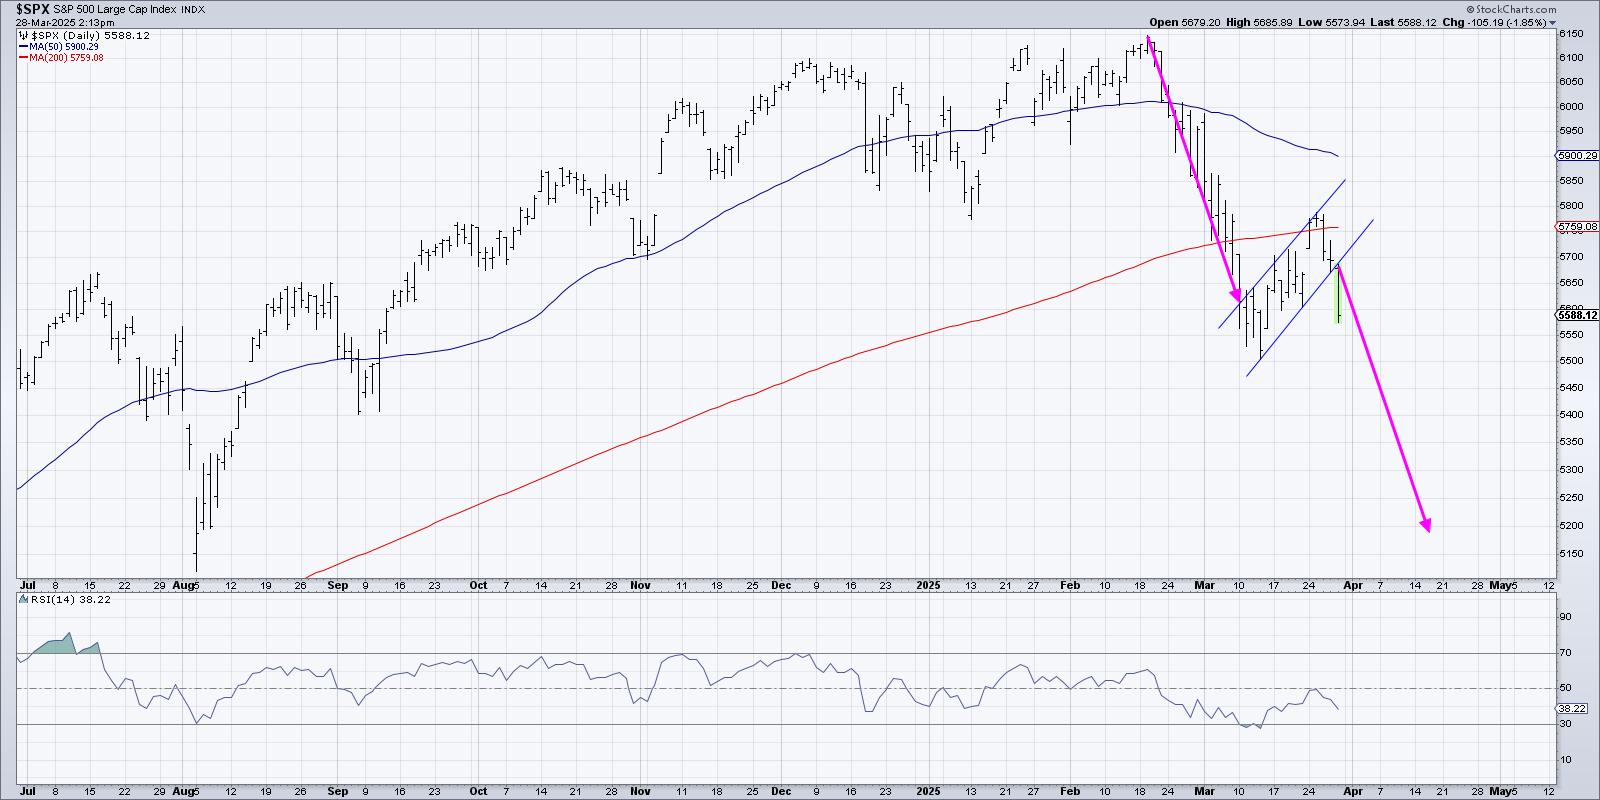
A bear flag occurs during a downtrend phase, where price begins a brief countertrend rally of higher highs and higher lows. This short-term uptrend swing formed by parallel trendlines represents a brief pause within the longer downtrend structure. If and when the price breaks below the lower trendline, that confirms the bear flag pattern and suggests a continuation of the bear phase.
A bear flag often occurs around the midpoint of the downtrend, which is why we can use the trend leading into the pattern as a way of projecting a minimum downside objective. Based on the daily S&P 500 chart, and assuming a confirmed bear flag pattern this week, that would suggest a downside objective around 5200.
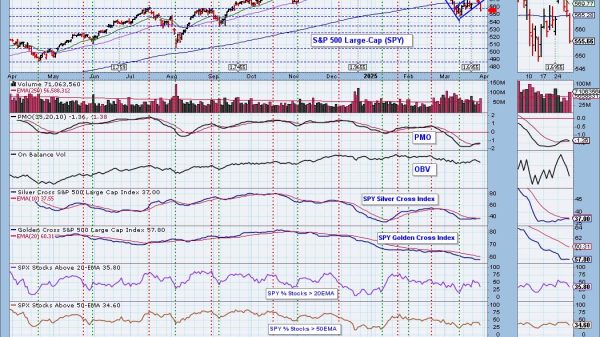
How else can we corroborate this indicator that implies a 16% drop from the February all-time high? The good news is that patterns like this don’t happen in a vacuum, so let’s review how this analysis relates to other areas of the technical toolkit.
Here, we can see that the swing low from earlier in March lined up almost perfectly with a 61.8% retracement of the August 2024 to December 2024 bull phase. The subsequent bounce earlier this month drove the S&P 500 up to test its 200-day moving average from below, a level which coincided with the price gap formed around election day in November.
I always think of charts in terms of key price levels, what I call “lines in the sand,” so I can set alerts and focus on taking action only when the chart confirms a new trend. In this case, the 5500 level seems to be the most important price point to monitor, as a violation of that support level would mean a breakdown through Fibonacci support as well as the March swing low.
Assuming a break below 5500, the S&P 500 would then have a clear path to a new downside objective in the 5100-5200 range. The 5200 target is derived from the bear flag pattern described today, while the 5100 level is based on a longer-term Fibonacci structure using the October 2022 low.
It’s worth noting that none of these targets are absolute guarantees! Only by analyzing trend, breadth, and momentum readings along the way down can we validate the likelihood of further deterioration. I sign off every episode of my daily market recap show with the tagline, “It’s always a good time to own good charts.” Based on this week’s bear flag pattern, the S&P 500 just isn’t a good chart.
One more thing… We interviewed options expert Jay Soloff last week on the Market Misbehavior podcast in what ended up being a masterclass on the VIX. If you’ve ever wondered what the VIX represents and how investors can use it to assess market conditions, you should make the time to listen in!
RR#6,
Dave
P.S. Ready to upgrade your investment process? Check out my free behavioral investing course!
David Keller, CMT
President and Chief Strategist
Sierra Alpha Research LLC
Disclaimer: This blog is for educational purposes only and should not be construed as financial advice. The ideas and strategies should never be used without first assessing your own personal and financial situation, or without consulting a financial professional.
The author does not have a position in mentioned securities at the time of publication. Any opinions expressed herein are solely those of the author and do not in any way represent the views or opinions of any other person or entity.