


If you regularly follow the SCTR Reports (StockCharts Technical Rank), you’ll notice that some top-ranked stocks aren’t just individual standouts but groupings that call attention to particular sectors, industries, or subgroups within the two.
That’s exactly what happened Tuesday morning. A couple of high-ranking stocks pointed to a growing trend in the thematic subsector of quantum computing.
Quantum Computing Stocks Light Up the SCTR Reports
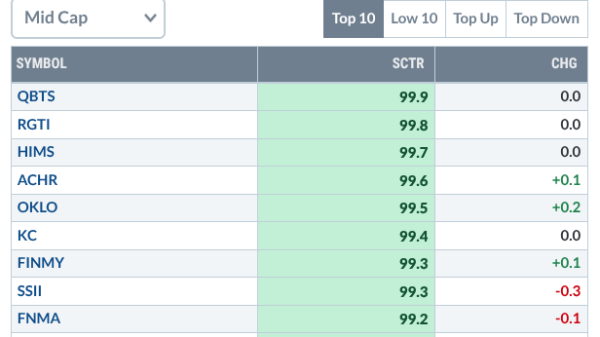
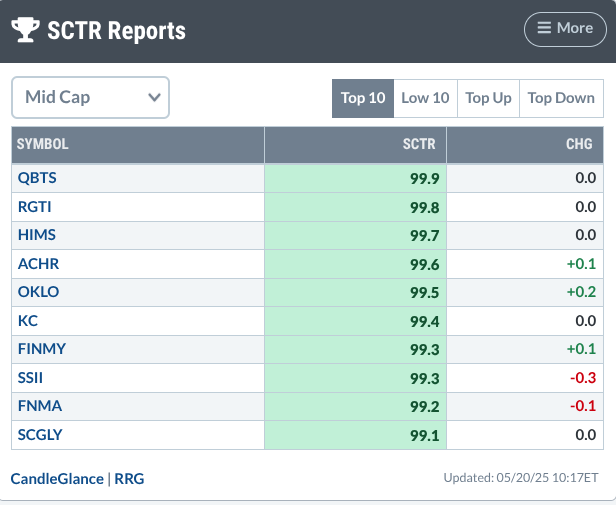
Occupying the top ranks of the Mid Cap SCTR Top 10 list are quantum computing stocks D-Wave Quantum Inc. (QBTS) and Rigetti Computing, Inc. (RGTI).
FIGURE 1. SCTR REPORTS – MID CAP TOP 10. QBTS and RGTI, occupying the top of the list, signal strength in the quantum computing subsector.
The quantum computing subsector made headlines Tuesday morning, with QBTS leading the charge.
QBTS Leads on Breakout News and Bullish Technical Scans
QBTS shares surged after the company unveiled Advantage2, its most advanced quantum system to date. A quick look at QBTS’s Symbol Summary showed the stock appearing across multiple bullish technical scans on Tuesday, including New 52-week Highs, P&F Double Top Breakout, and Runaway Gap Ups.
Other quantum names, including RGTI, also saw gains, highlighting growing momentum in the space.
RGTI Gains Momentum with Unique Technical Setups
RGTI’s Symbol Summary profile revealed a different set of predefined scans, suggesting unique technical setups driving its price action. RGTI was triggered in the P&F Ascending Triple Top Breakout, Elder Bar Turned Blue, and P&F Double Top Breakout predefined scans on Tuesday.
With quantum computing stocks like QBTS and RGTI surging and showing unusually strong technical strength, assessing their investment potential requires more than a few headlines. Comparative strength, broader performance of sectors to which they belong, and the underlying factors shaping their price action are some other factors to consider.
FIGURE 2. PERFCHARTS OF QBTS, RGTI, XLK, AND QQQ. At these levels of outperformance, it becomes difficult to separate justified valuations from pure FOMO. As the PerfCharts comparison shows, RTGI and QBTS stocks are outperforming their sector and broader tech-heavy index.
Technical Breakout: What to Watch with QBTS’ Next Move
From a technical perspective, does either stock present a favorable structure for a market entry? To evaluate this, let’s start with a daily chart of QBTS.
FIGURE 3. DAILY CHART OF QBTS. An impressive parabolic run, support on the downside is relatively clear.
QBTS broke out above its four-month trading range, shooting up to an all-time high of $17.50 on Tuesday’s session, sending the Relative Strength Index (RSI) deep into overbought territory. The Price Channels identify potential areas of support based on previous swing highs and lows.
If QBTS is overbought because its valuations are too high, then a pullback is likely to follow. Whether you should buy the dip depends on your fundamental thesis, but technically, if you decide to enter a position, consider this:
QBTS is likely to find support at the top of its previous range, highlighted in green.If it falls below that, there’s another support range, shaded yellow, that marks another set of minor swing highs in the middle of the previous trading range.Below that, however, is support at a low range, shaded red, where the stock has reversed several times over the last few months.
However, if QBTS drops into the zone between the yellow and red support levels, it could signal a meaningful loss of momentum and growing weakness in the stock’s trend.
That’s why volume becomes especially important here. Note how volume has risen with each successive surge—an encouraging sign of accumulation that somehow dropped at each price peak. If QBTS holds above the top of its previous range, watch for continued volume support; strong follow-through should be backed by equally strong participation.
RGTI Chart Shows Upside Potential—But With Caution
Now let’s look at the second one up on the SCTR Top 10 list. Here’s a daily chart of RGTI.
FIGURE 4. DAILY CHART OF RGTI. The stock is moving steadily upward, but unlike QBTS, there’s no outstanding catalyst to trigger an immediate and outsize move.
Following a fourth bounce at the $7 support range, RGTI broke above resistance, almost hesitantly, at $11. The Volume-by-Price overlay on the left side of the chart shows heavy trading activity in this range, suggesting it could become a strong support level now that resistance has been broken. The ZigZag line further clarifies the support and resistance levels, helping to visualize the stock’s overall trend structure.
The On Balance Volume (OBV) indicator in the bottom panel reflects steady buying pressure. At the same time, the RSI, currently at 61 and rising, suggests the stock still has room to climb before entering overbought territory.
If RGTI maintains its upward trajectory, the next meaningful resistance level ahead will be at $16, marking its January high. However, whether it gets there may depend less on chart patterns and more on underlying catalysts.
In other words, is RGTI riding the wave of bullish sentiment in quantum computing stocks, or does it have a meaningful fundamental catalyst driving its move higher? On that note, what about QBTS?
Wall Street Weigh In: Real Catalysts or Quantum Hype?
Be careful. Analysts are cautiously optimistic about both stocks, pointing to real catalysts like RGTI’s government partnerships and QBTS’s Advantage2 launch. However, some on Wall Street caution that recent gains may be driven more by hype than fundamentals, with commercial adoption still a long way off.
Action Steps
Monitor the support levels. For QBTS, watch the green zone (prior range top) for dip-buying potential; deeper moves into yellow or red zones may signal weakening momentum.Track volume behavior. Continued surges should be matched with strong volume to confirm trend strength.Stay grounded. If you’re trading, closely follow the technicals. If you’re investing, make sure your thesis includes realistic expectations on commercialization timelines.
At the Close
Quantum computing stocks like QBTS and RGTI are showing impressive momentum, backed by technical strength and growing investor interest. But while the setups look promising, remember to stay disciplined. Monitor support levels, watch volume closely, and don’t lose sight of the long runway ahead for true commercial adoption.
Disclaimer: This blog is for educational purposes only and should not be construed as financial advice. The ideas and strategies should never be used without first assessing your personal and financial situation, or without consulting a financial professional.