The Cybersecurity ETF (CIBR) has been leading the market for a solid four months and recorded yet another new high this week. Chartists looking to take advantage of this leadership can use two timeframes: one to establish the absolute and relative trends, and another to identify tradable pullbacks along the way. Note that CIBR has been on our radar for four months and was featured in October.
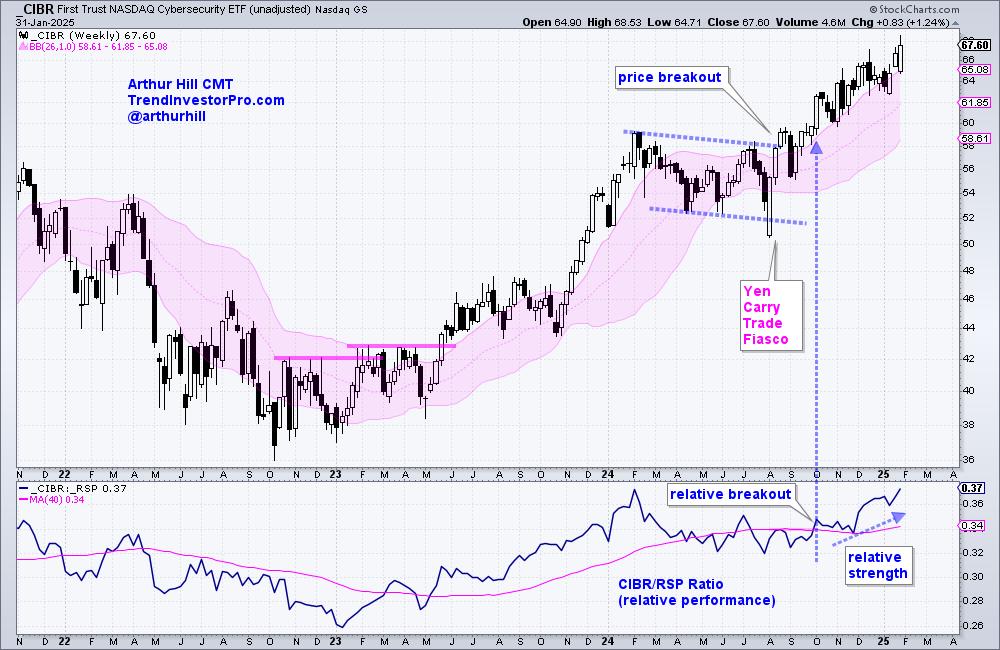
The first chart shows weekly candlesticks over the last three years. CIBR surged from November-2023 to January 2024 and then formed a long consolidation pattern from February to September. CIBR broke consolidation resistance at 58 in September (price breakout) and closed above 68 this week. This breakout opened to door to the current run.
The indicator window shows the CIBR/RSP ratio to measure relative performance. This ratio rises when CIBR outperforms the broader market (S&P 500 EW ETF (RSP)) and falls when CIBR underperforms. This ratio broke out in early October to signal relative strength in CIBR (relative breakout). The price breakout and relative breakout proved a power combination. Keep this in mind.
With CIBR in an uptrend and leading in October, chartists can turn to daily charts to identify tradable patterns along the way. For patterns, we can use flags and pennants, which are short-term bullish continuation patterns. Most recently, CIBR broke out of a pennant in mid January and this foreshadowed the run to new highs. We highlighted this pattern in our Chart Trader report as it took shape in mid January.
Chartists can also use indicators to identify tradable pullbacks within a strong uptrend. The bottom window shows Percent-B, which dips below 0 when the close is below the lower Bollinger Band (20,2). This is a “true” oversold condition because price is more than two standard deviations below the 20-day SMA. Percent-B, however, did not dip below zero and become truly oversold. Instead, it became moderately oversold with dips below .20 on December 31st and January 13th. We have to take what the market gives us. This moderately oversold condition coincided with the flag and pennant patterns.
This week at TrendInvestorPro we analyzed three AI ETFs that cover three distinct areas (AI infrastructure, physical AI, AI software and apps). Our reports and video also highlighted leadership in ETFs related to Cloud Computing and Software, as well as the recent breakout in the Biotech ETF. Click here to learn more and gain immediate access.
///////////////////////////////////////////////////


